
Relief map of the Caucasus Ecoregion with records of a spider species.
Maintaining a large faunistic database and compiling some of its content using PHP scripts for easy access is nice – and digging deeper into data analysis using the R language is so much more!
These pages aim at documenting my own step-by-step advances in learning R and its capabilities in spatial analyses as well as making the scripts and outputs available to fellow R (spatial) students and/or researchers studying ecological and/or spatial aspects of the Caucasus Ecoregion.
In the map you can see the result of the first few days of diving into the R spatial package: plotting occurrence data of the spider species Diplostyla concolor from the CaucSpiders Database onto a relief map using the SRTM Digital Elevation Data provided via the getData function in R’s spatial package.
I’d be very happy to receive feedback on these pages, especially hints on improving the scripts, other useful functions, links to resources and the likes. Just leave a comment below or write me an email.
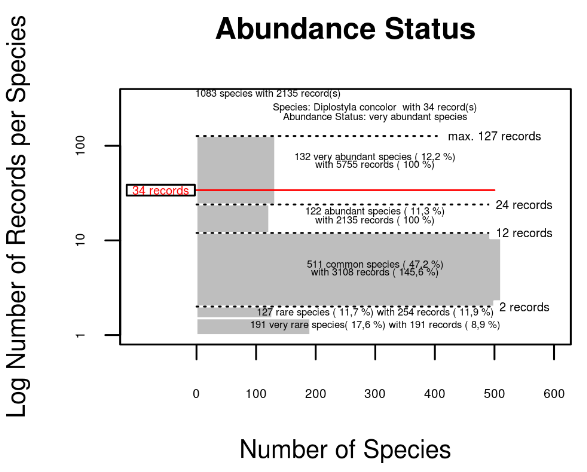
A graph relating the abundance of Diplostyla concolor to the abundance distribution of all species in the database (based on non-paramatric distribution of values).
The Raster Basics 1 and Raster Basics 2 deal with how to get raster data and shapefiles of country borders and the likes in order to produce the first maps with elevation data.
The first spatial analysis is showcased in the Raster Basics 3, where area sizes of polygons and raster objects are calculated.
Later pages are planned to show database access, plotting of database information (i. e. species records) and simple analyses such as analyses of species abundance, altitudinal distribution of species etc.
Have fun with R!